Before the next heatwave reaches a European solar portfolio, someone in operations will sit with weather forecasts open side by side and a deadline that does not move. The day-ahead generation forecast has to be filed and the battery plan for the hottest hours set. AI and physics models will not agree on the heat peak, and somebody has to choose which line goes into the power model.
We have just set up a team at Edgion to bring in weather data and compare models, and this was the first question that refused to stay small. It looks like plumbing, but everything else rests on it: if the heat peak going in is wrong, tuning downstream will not win it back.
Hotter is not more power
European heatwaves look like a gift to a solar farm: they usually sit under a blocking high or ridge whose sinking air clears the sky. But as a general rule for crystalline silicon, output falls by roughly 0.3 to 0.5% per °C of module temperature, so a forecast a few degrees too cool at the peak overstates output by about 1 to 2%. That is modest beside a missed cloud, but it lands on the hours that set battery charging, sales commitments and reserve. The bill arrives later: as imbalance cost, or, if it is corrected intraday, as a worse price.
The chain from air temperature to money is our own reasoning, untested by either weather study. We looked for evidence on the first link: air temperature at its extreme.
What others had already measured
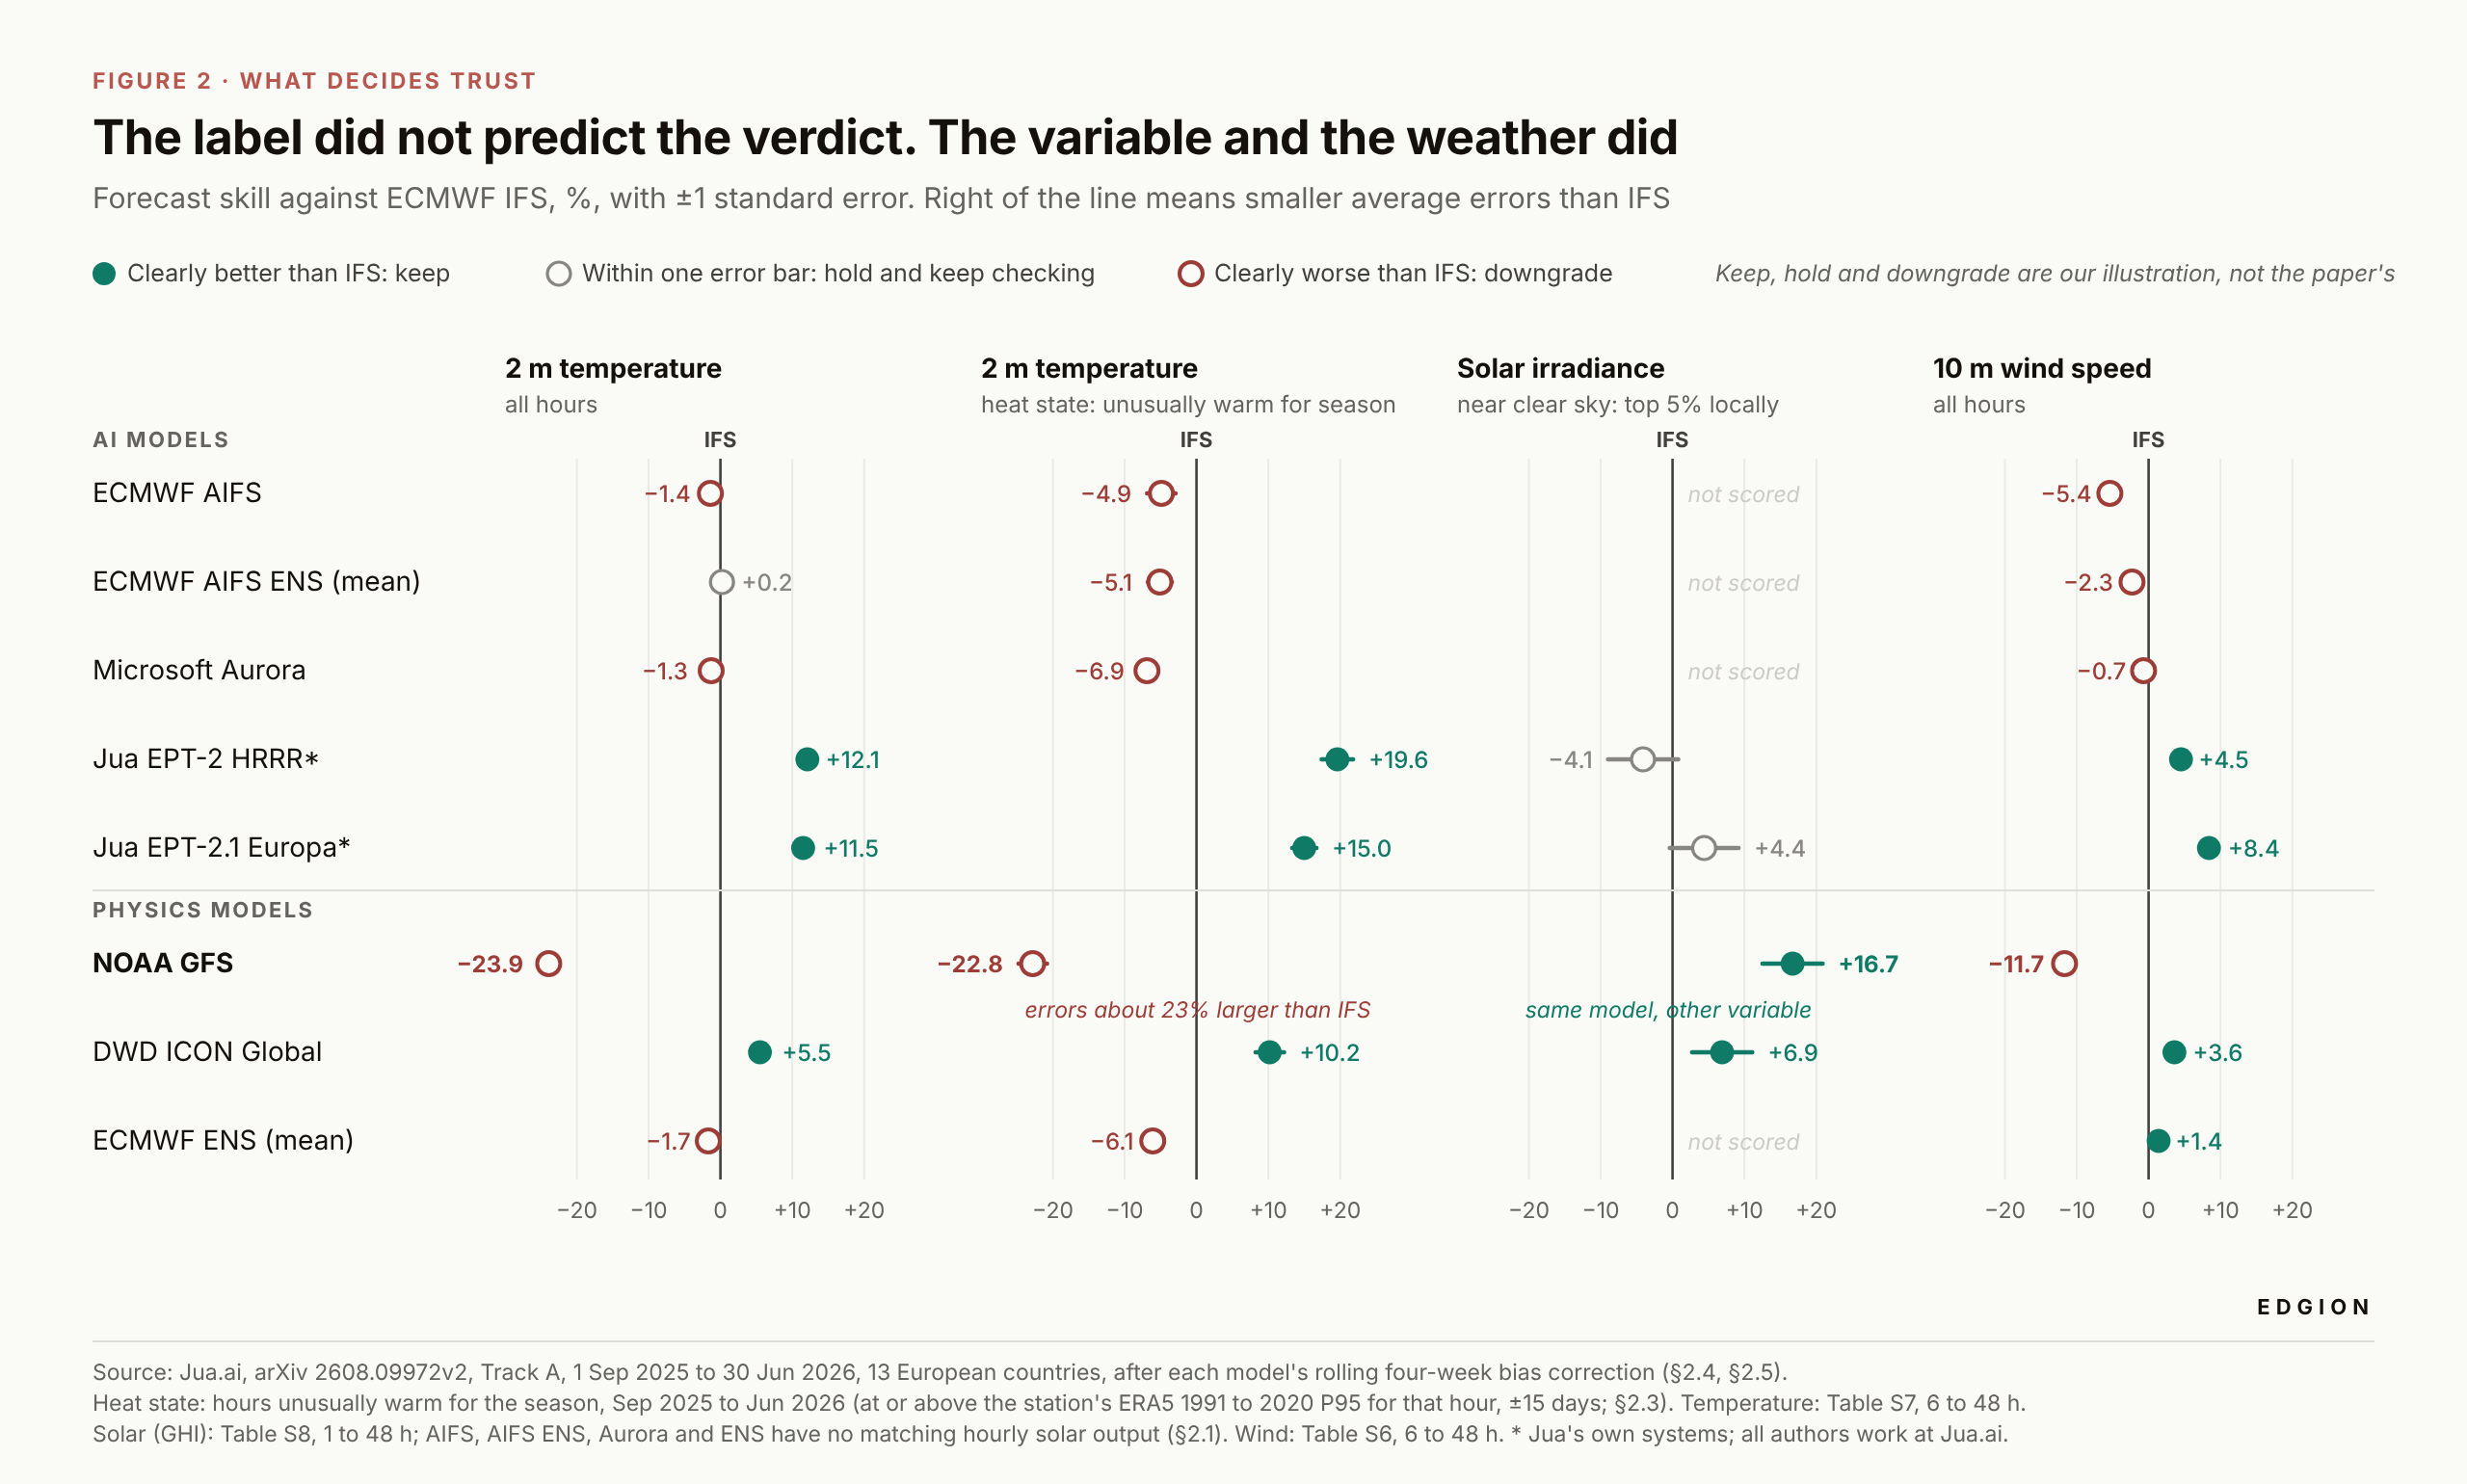
The most useful find was a Jua.ai preprint that checked 12 AI and physical models against IFS, ECMWF's high-resolution physics model, at stations in 13 European countries from 1 September 2025 to 30 June 2026, up to 48 hours ahead, after the authors remove each model's recent average bias. Its heat state is the hours hotter than 95% of that station's 1991 to 2020 climate for the same time of day and time of year. Below zero means larger average errors than IFS.
That makes it a first look, not proof about summer heatwaves. There is no July or August, and because the threshold moves with the season, most heat-state hours are warm for their season, not midsummer heat. Night hours count too, and low-sun months carry little PV weight.
Even so, labels did not predict the result. The largest deficit belonged to a physics model, NOAA's GFS, at −22.8: average errors about 23% larger than IFS, and below zero in every country with heat-state observations. ECMWF's AI models showed a modest deficit (AIFS −4.9, its ensemble mean −5.1, standard errors near 2). DWD's physical ICON Global scored +10.2. The paper's authors all work at Jua, and the top heat scores, +19.6 and +15.0, belong to Jua's own regional models. Around 24 hours ahead, little changes. These scores cover 2 m temperature only, and temperature cannot stand in for irradiance, which has to be checked separately; the paper scores solar extremes in near-clear-sky hours.
Across five pooled record-temperature events GFS reached −25.4, with wide uncertainty. Two warm-season heatwaves (late May and late June 2026) come closest to the case we worry about; the others were out-of-season record warmth in December, February and April.
We cross-checked with an independent study by Olivetti and Messori (Geoscientific Model Development, 2024, no competing interests declared), which tested other models on gridded reanalysis across all of 2020. AI model performance, they wrote, "varies by region, type of extreme event, and forecast lead time", and for hot extremes in Europe the ECMWF physics model mostly did better than the two AI models tested.
Every model in the Jua paper, IFS included, forecasts low values too high and high values too low, and errors change more from one weather state to another than from one model to another, so a muted peak only means something against a fixed reference.
What we do now
So we check before the power model.
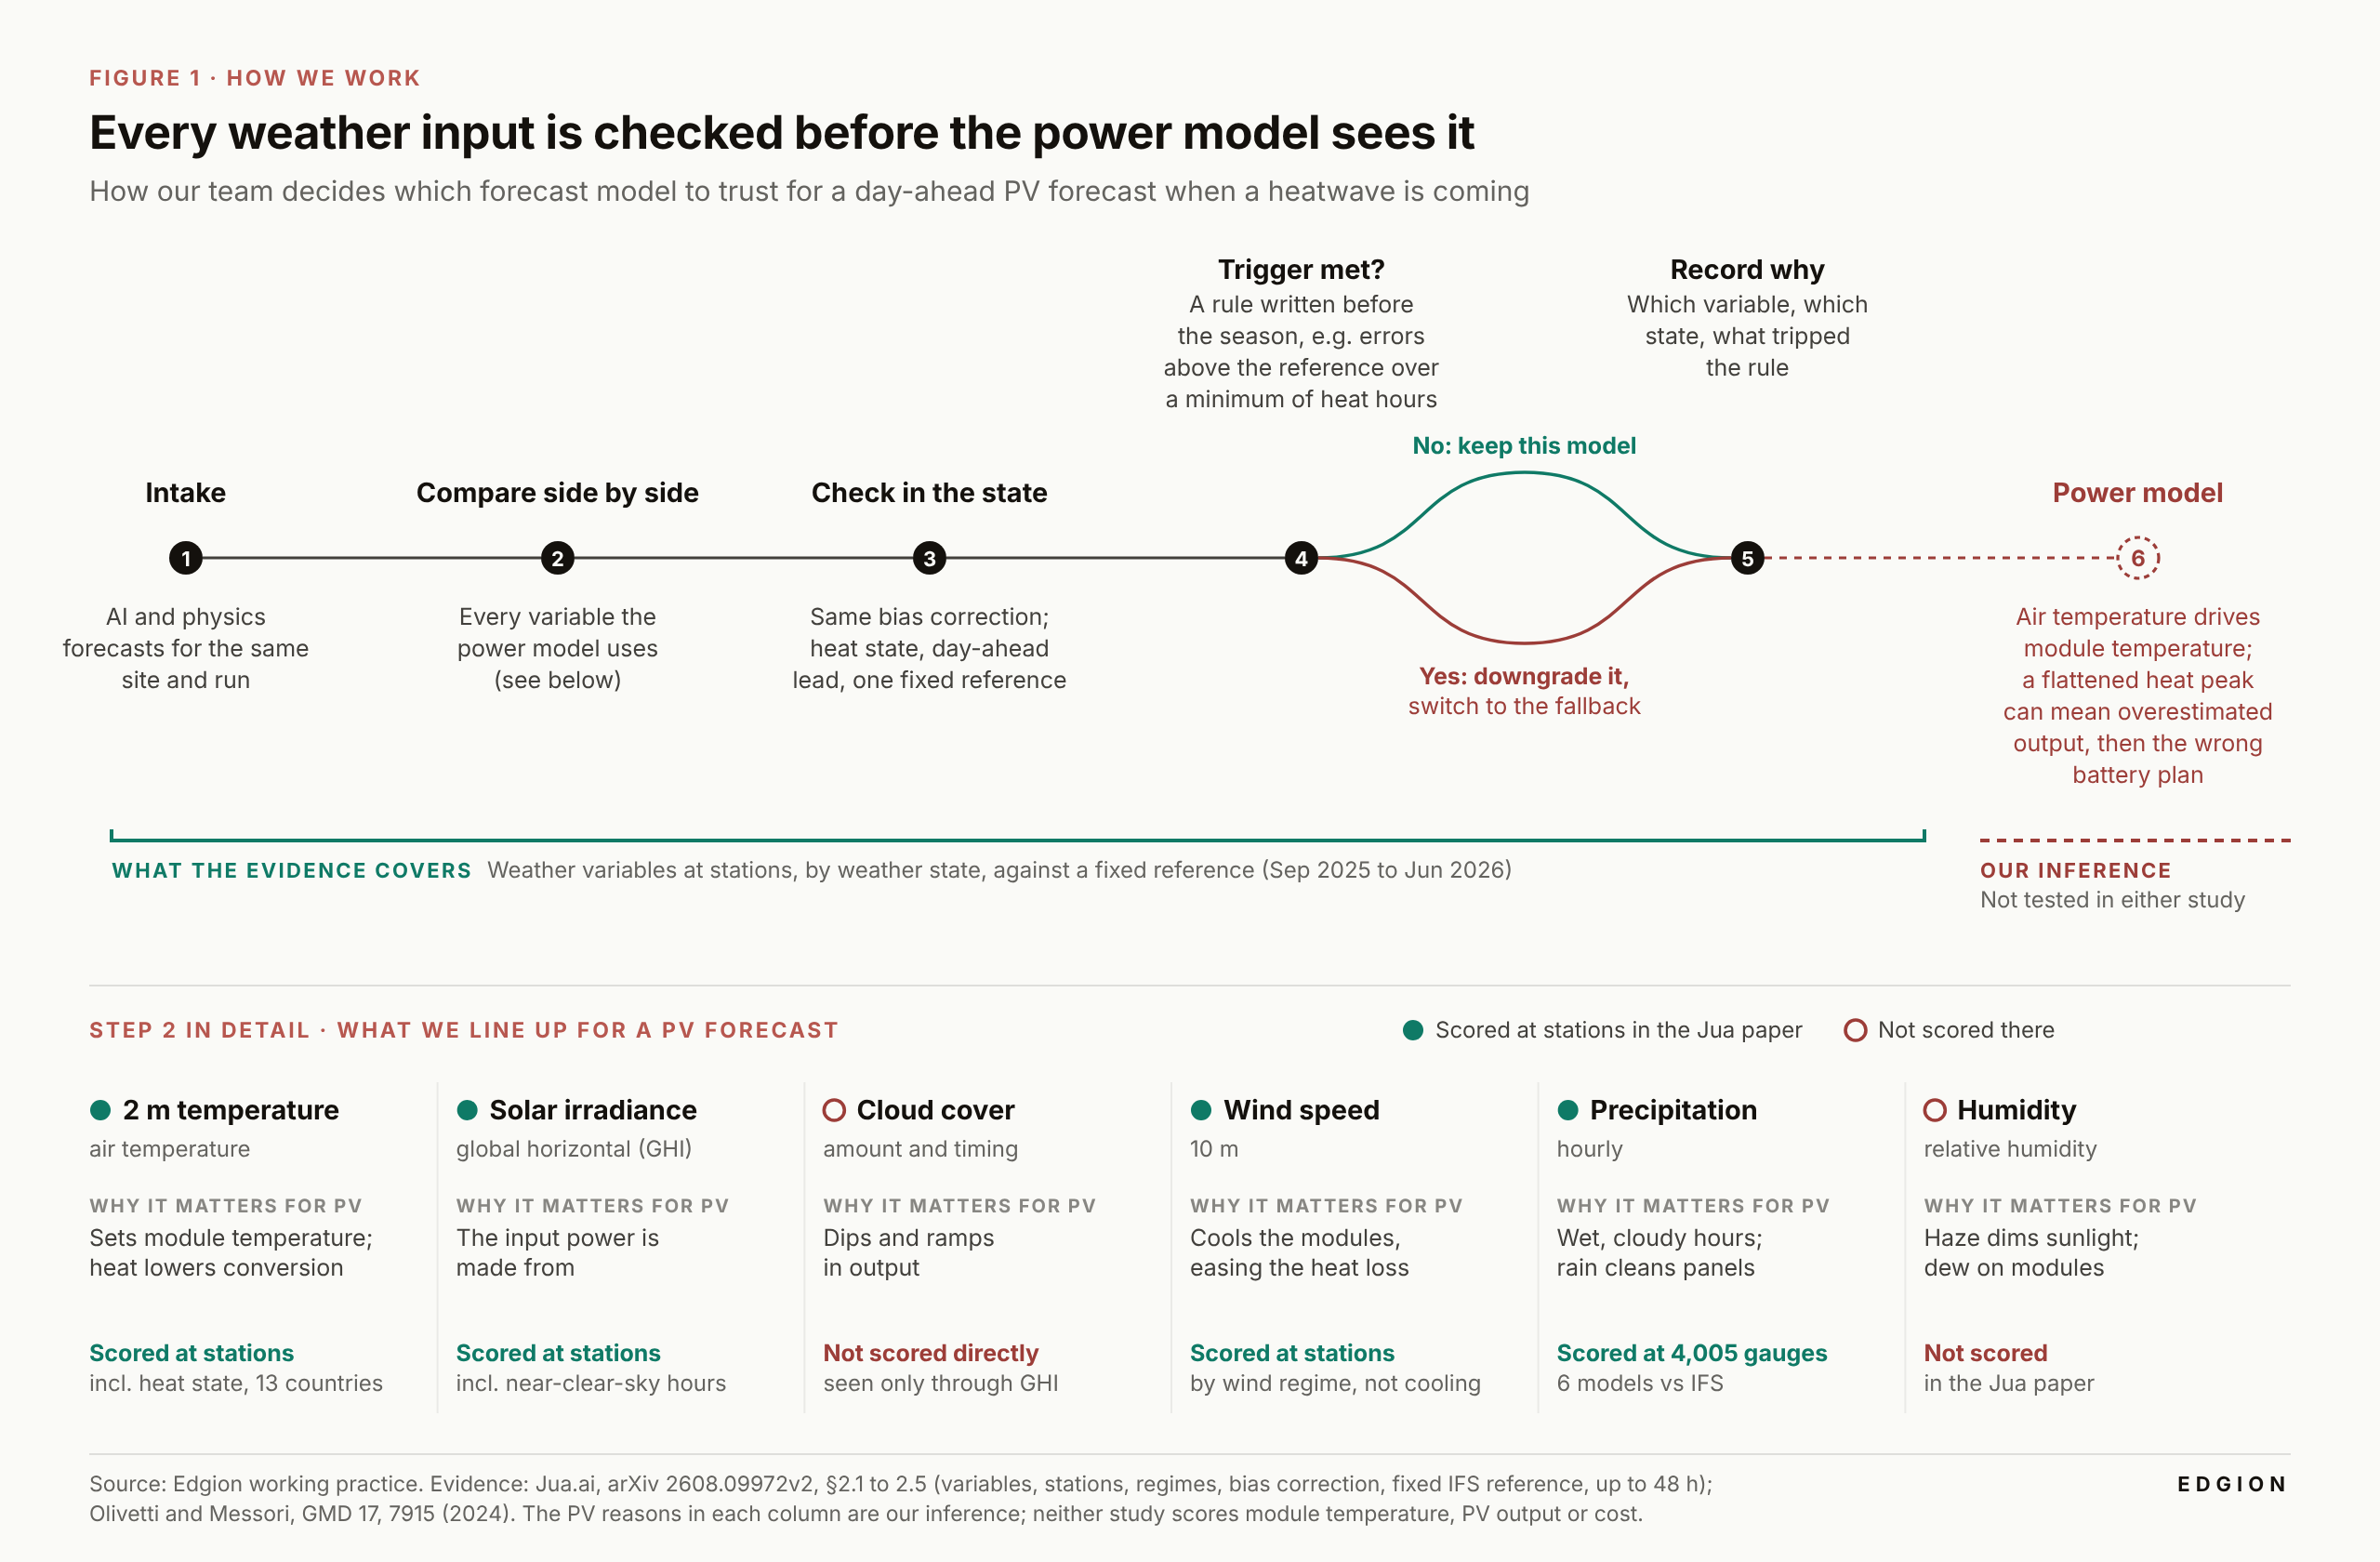
A PV forecast also leans on irradiance, cloud, wind that cools the modules, rain and humidity. The Jua paper scores all but cloud cover and humidity at stations; those rest on our own checks. For each variable we put the forecast models on the same bias-correction footing, then compare them against one fixed reference in the weather state and lead time that drive the decision: here, heat and day-ahead. Before the season we write down what would make us trust a model less, say, errors repeatedly larger than the reference over a minimum number of heat-state hours. When that happens we switch to the fallback and note why.
Trust attaches to a variable and a state, not to a model. GFS, far below IFS for heat-state temperature, beats it in near-clear-sky solar hours at +16.7. One model can serve for irradiance while another sets the temperature peak, so we check that the combined input agrees with itself: clear sky and heat should arrive together.
Some of the work is still ours, and the paper is candid about where it stops. It compares finished systems, so it cannot say which inputs, configuration, training or post-processing make one model hold up, or pin the result on AI versus physics. It scores ensembles by their averages, not by how well they judge the odds of an extreme. And it shows where models differ, not why.
For wind power, 10 m wind scores cannot stand in for hub-height or gust variables.
What stays with us is how ordinary the fix is. Before the next heatwave, ask of every weather input: which variable, in which weather state, at what lead time, against what reference, and what would make us put it down? The full summer test is still ahead. Check the weather before you tune the power model.
Sources
1. Gabler, M. V., Molinaro, R., Siegenheim, N., Martin, H., Frey, M., Poulsen, N., Seitz, P. and Lam, O. (Jua.ai). Do AI Weather Models Miss Extremes? Evidence from Ten Months of Verification against European Weather Stations. arXiv:2608.09972v2, 6 Oct 2026. Period and lead times: §2.5; heat-state definition: §2.3; bias correction: §2.4; heat-state values: Table S7; 24 h: Table S14; by country: Table S4; record-temperature events: Tables S25 and S26; solar: Table S8; wind: Table S6; variables and stations: §2.1 to 2.2; shared error pattern: §3.2; limitations: §4.1; author affiliation: Ethics statement.
2. Olivetti, L. and Messori, G. Do data-driven models beat numerical models in forecasting weather extremes? A comparison of IFS HRES, Pangu-Weather, and GraphCast. Geoscientific Model Development 17, 7915-7962, 2024. https://doi.org/10.5194/gmd-17-7915-2024
3. Temperature effect on PV output (general PV knowledge): PVEducation, "Effect of Temperature", https://www.pveducation.org/pvcdrom/solar-cell-operation/effect-of-temperature (0.4 to 0.5% per °C for silicon); Canadian Solar TOPBiHiKu6 datasheet, CS6.2-66TB (−0.29% per °C, Pmax).
4. Heatwaves and blocking: Kautz, L.-A. et al. Atmospheric blocking and weather extremes over the Euro-Atlantic sector: a review. Weather and Climate Dynamics 3, 305, 2022. https://wcd.copernicus.org/articles/3/305/2022/
5. Hero photo: Markus Spiske, "Solar Panels on Green Grass Field", Pexels, https://www.pexels.com/photo/solar-panels-on-green-grass-field-11145690/ (Pexels License).